Hi @tangjm 
That’s an awesome question, my first guess is that LEFT JOIN should be a bit slower. LEFT JOIN produces more data because there are event records without user_id:
SELECT
  'left_join_records' AS label,
  COUNT(*) AS records_count
FROM mobile_analytics.events u
LEFT JOIN mobile_analytics.events e
  ON e.user_id = u.user_id

UNION

SELECT
  'inner_join_records' AS label,
  COUNT(*) AS records_count
FROM mobile_analytics.events u
INNER JOIN mobile_analytics.events e
  ON e.user_id = u.user_id
Altough I’m sure that the SQL planner in PostgreSQL counts WHERE conditions and the final result set size is the same:
SELECT
  'left_join_records' AS label,
  COUNT(*) AS records_count
FROM mobile_analytics.events u
LEFT JOIN mobile_analytics.events e
  ON e.user_id = u.user_id
WHERE
  u.action = 'signup'

UNION

SELECT
  'inner_join_records' AS label,
  COUNT(*) AS records_count
FROM mobile_analytics.events u
INNER JOIN mobile_analytics.events e
  ON e.user_id = u.user_id
WHERE
  u.action = 'signup'
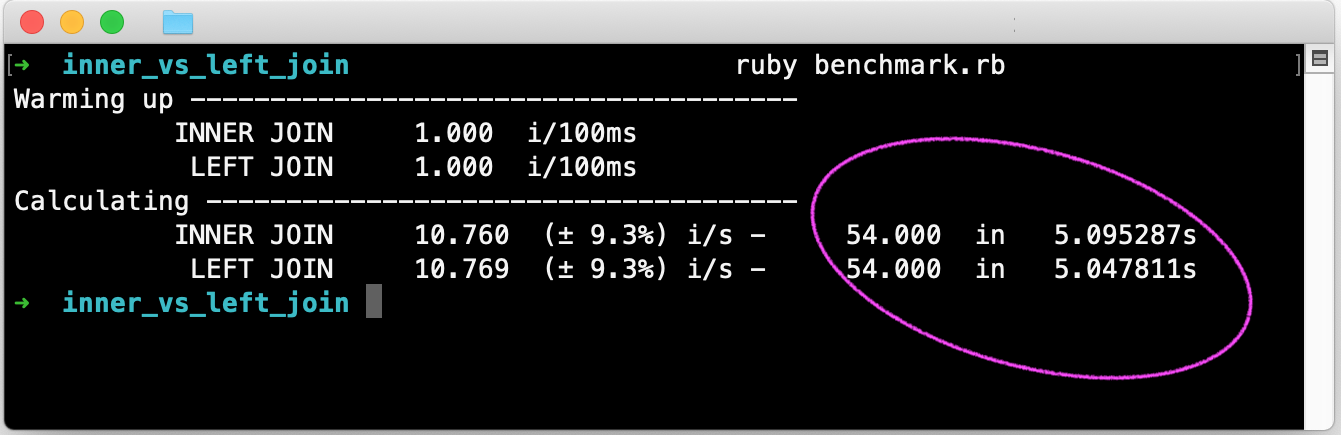
I believe the speed for INNER JOIN and LEFT JOIN queries should be equal. I see this when I run a benchmark on my computer:
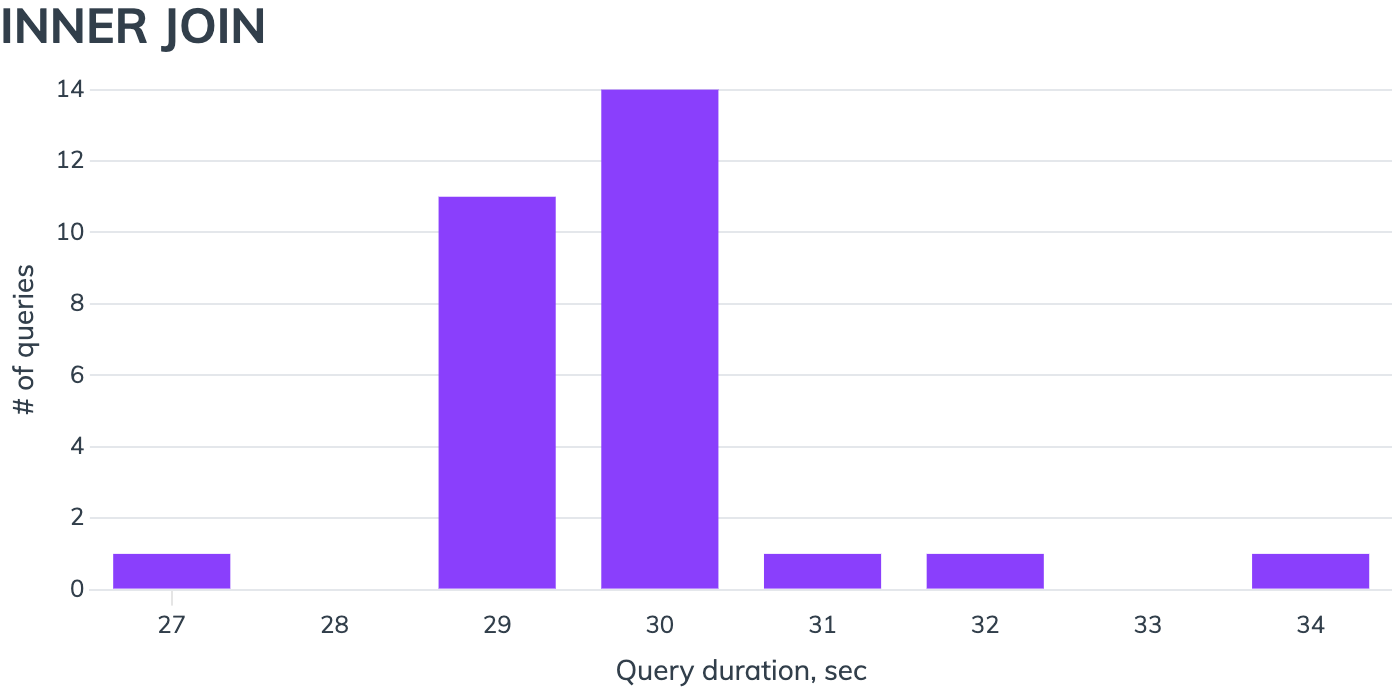
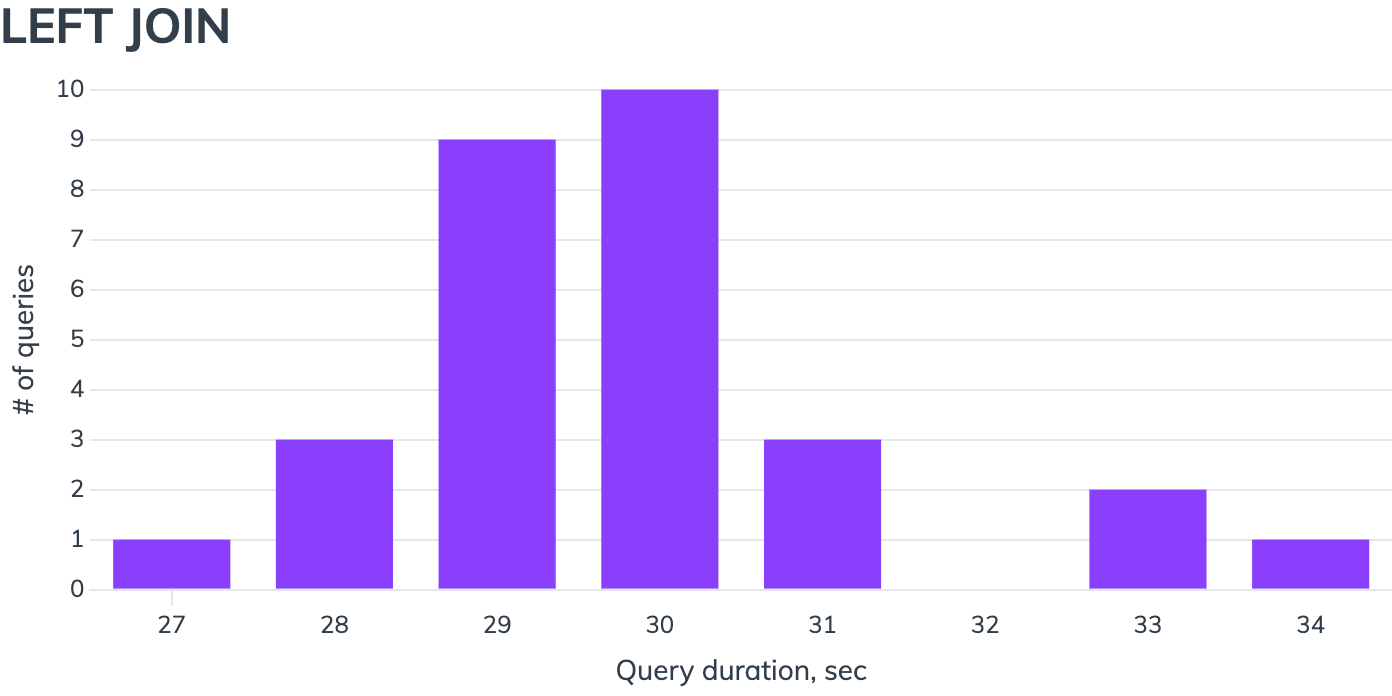
Simulation with a big dataset
I also generated several gigabytes of events data to test our assumption with slow queries (~30 sec in this experiment).
As you can see, both query duration distributions look very similar: